
It seems like all the best R packages proudly use GitHub and have a README adorned with badges across the top. The recent Microsoft acquisition of GitHub got me wondering: What proportion of current R packages use GitHub? Or at least refer to it in the URL of the package description. Also, what is the relationship between the number of CRAN downloads and the number of stars on a repository? My curiosity got the best of me so I hastily wrote a script to pull the data. Click here to go straight to the full script and data included at the bottom of this post. I acknowledge there are more elegant ways to have coded this, but let’s press on.
Pulling List of Packages & their Details
CORRECTION: I orginally posted this article with code that scraped CRAN to get the
list of packages and their metadata. This could violate CRAN Terms and Conditions
and generally isn’t responsible. Thanks to Maëlle Salmon (@ma_salmon)
I was reminded of how to scrape responsibly and that there is a function, tools::CRAN_package_db(),
that returns all the metadata for the current packages on CRAN. I have written another
blog post entitled Scraping Responsibly with R
that details how to use the robotstxt package from rOpenSci to check a domain’s
directive on bots. Without scraping CRAN here is how you get the package metadata:
pkgs <- tools::CRAN_package_db()
# remove duplicate MD5sum column since tibbles can't handle duplicate column names
pkgs <- pkgs[,unique(names(pkgs))]
pkgs %>%
  select(Package, Version, Author, BugReports, URL) %>%
  as.tibble()
#> Warning: `as.tibble()` is deprecated as of tibble 2.0.0.
#> Please use `as_tibble()` instead.
#> The signature and semantics have changed, see `?as_tibble`.
#> This warning is displayed once every 8 hours.
#> Call `lifecycle::last_warnings()` to see where this warning was generated.
#> # A tibble: 16,070 x 5
#>    Package  Version Author                  BugReports          URL
#>    <chr>    <chr>   <chr>                   <chr>               <chr>
#>  1 A3       1.0.0   "Scott Fortmann-Roe"    <NA>                <NA>
#>  2 aaSEA    1.1.0   "Raja Sekhara Reddy D.… <NA>                <NA>
#>  3 AATtools 0.0.1   "Sercan Kahveci [aut, … https://github.com… <NA>
#>  4 ABACUS   1.0.0   "Mintu Nath [aut, cre]" <NA>                https://shiny.a…
#>  5 abbyyR   0.5.5   "Gaurav Sood [aut, cre… http://github.com/… http://github.c…
#>  6 abc      2.1     "Csillery Katalin [aut… <NA>                <NA>
#>  7 abc.data 1.0     "Csillery Katalin [aut… <NA>                <NA>
#>  8 ABC.RAP  0.9.0   "Abdulmonem Alsaleh [c… <NA>                <NA>
#>  9 abcADM   1.0     "Zongjun Liu [aut],\n … <NA>                <NA>
#> 10 ABCanal… 1.2.1   "Michael Thrun, Jorn L… <NA>                https://www.uni…
#> # … with 16,060 more rows
From there I looked at the package description fields "URL" and "BugReports" to see
if either contained “github.com”. It turns out that 3,718 of the packages (29.3%
of the total) referenced GitHub. After retrieving the package metadata I pinged
the GitHub API to see if I could get the number of stars for the repository. Currently,
GitHub allows 5,000 authenticated requests per hour (link),
but out of all the packages only 3,718 referenced GitHub, so I could make all the requests at once.
Here is the function I used to take a cleaned up version of the package’s URL then
form a request to the GitHub API to get star counts:
# get the star count from a clean version of the package's URL
gh_star_count <- function(url){
  stars  <- tryCatch({
    this_url <- gsub("https://github.com/", "https://api.github.com/repos/", url)
    req <- GET(this_url, gtoken)
    stop_for_status(req)
    cont <- content(req)
    cont$stargazers_count
  }, error = function(e){
    return(NA_integer_)
  })
  return(stars)
}
Analyzing the Data
Once I had all the package detail data, I found that R packages, on average, have 35.7 GitHub stars, but the median number of stars is only 6! ggplot2 has the most stars with 3,174. In my analysis I removed the xgboost, h2o, and feather packages which point to the repository of their implementations in many languages, not just R.
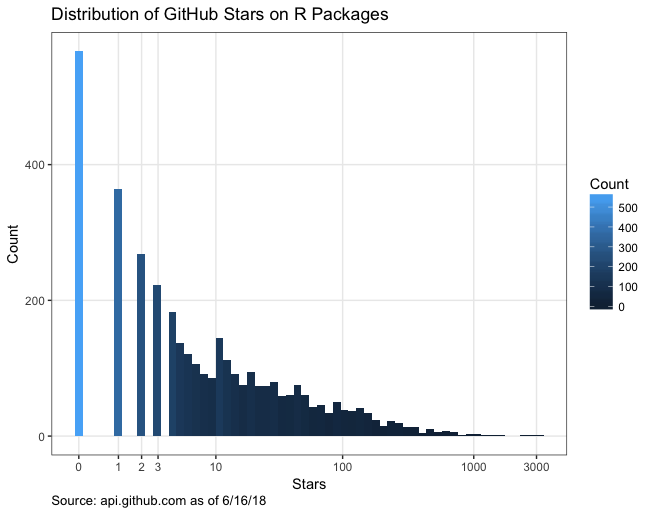
What I really found interesting was comparing CRAN downloads to GitHub repo stars. Using the cranlogs package I was able to get the total package downloads dating back to January 1, 2014. In contrast with the low star counts, the median downloads for R packages is 8,975. Combining stars and downloads data I found that the median R package has 903 downloads per star. Only 38.7% of packages had more than 10 stars, which shows how hard stars are to get even if you’ve written a great package. I’m not sure what proportion of R users frequently reference and contribute to GitHub, but it would be interesting to compare that with the high ratios of downloads to stars.
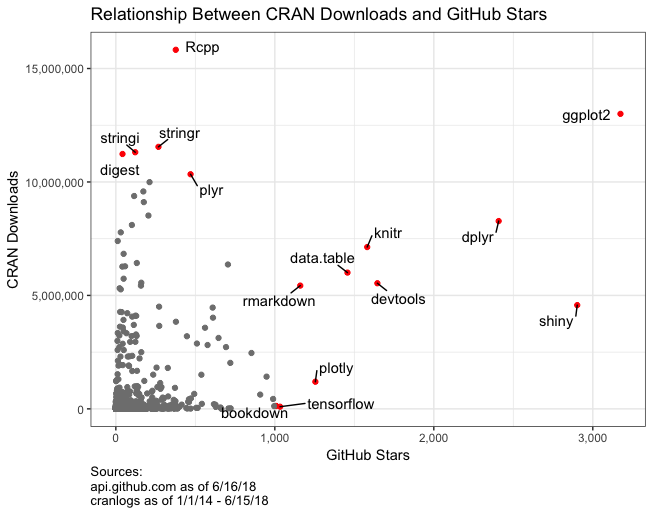
There are some real outliers in the data. For example, the Rcpp package, perhaps the most downloaded package of all-time, has 15.8M downloads and only 377 stars. Similarly, Hadley’s scales package has 9.4M downloads and only 115 stars. These support/helper packages just don’t get the same star love as the headliners like ggplot2, shiny, and dplyr.
Of course, I could not help but check out the stats for some of the most prolific package authors.
After parsing out individuals with the ["aut", "cre"] roles I came to the not so surprising
conclusion that Hadley has the most stars of any author with 12,408 stars. In contrast, Dirk Eddelbuettel had one
of the lowest star-to-download ratios. For every ~38K downloads Dirk’s repositories will receive one star.
Pay no attention to the man behind the curtain since his Rcpp package underpins a whole
host of packages without all the GitHub fanfare. Here is a list of popular R package
authors and their stats:
| Author | Notable Packages | Downloads | Stars | Downloads Per Star |
|---|---|---|---|---|
| Hadley Wickham | ggplot2, dplyr, httr | 113,160,314 | 12,408 | 9,119.9 |
| Dirk Eddelbuettel | Rcpp, BH | 28,433,586 | 745 | 38,165.9 |
| Yihui Xie | knitr, rmarkdown, bookdown | 42,472,860 | 6,315 | 6,725.7 |
| Winston Chang | R6, shiny | 17,161,005 | 4,027 | 4,261.5 |
| Jennifer Bryan | readxl, gapminder, googlesheets | 6,055,774 | 1,714 | 3,533.1 |
| JJ Allaire | rstudioapi, reticulate, tensorflow | 8,882,553 | 2,798 | 3,174.6 |
| Jeroen Ooms | jsonlite, curl, openssl | 25,907,868 | 1,483 | 17,469.9 |
| Scott Chamberlain | geojsonio, taxize | 1,770,664 | 2,528 | 700.4 |
| Jim Hester | devtools, memoise, readr | 22,867,071 | 4,332 | 5,278.6 |
| Kirill Müller | tibble, DBI | 36,159,009 | 1,077 | 33,573.8 |
I’m sure you could create mixed models to determine the unique download to star relationship for individuals. Also, you could use other package attributes to predict stars or downloads, but I’ll leave that to another curious soul. I will include tables below regarding the top 10 most downloaded, most starred, most and least downloaded per star.
Appendix
Top 10 Most Starred Packages
| Name | Author | Downloads | Stars | Downloads Per Star |
|---|---|---|---|---|
| ggplot2 | Hadley Wickham | 13,001,703 | 3,174 | 4,096.3 |
| shiny | Winston Chang | 4,571,794 | 2,902 | 1,575.4 |
| dplyr | Hadley Wickham | 8,276,844 | 2,408 | 3,437.2 |
| devtools | Jim Hester | 5,536,730 | 1,645 | 3,365.8 |
| knitr | Yihui Xie | 7,131,564 | 1,581 | 4,510.8 |
| data.table | Matt Dowle | 6,005,795 | 1,457 | 4,122.0 |
| plotly | Carson Sievert | 1,195,880 | 1,255 | 952.9 |
| rmarkdown | Yihui Xie | 5,432,495 | 1,160 | 4,683.2 |
| tensorflow | JJ Allaire | 94,856 | 1,033 | 91.8 |
| bookdown | Yihui Xie | 126,586 | 1,009 | 125.5 |
Top 10 Most Downloaded Packages with Stars
| Name | Author | Downloads | Stars | Downloads Per Star |
|---|---|---|---|---|
| Rcpp | Dirk Eddelbuettel | 15,824,781 | 377 | 41,975.5 |
| ggplot2 | Hadley Wickham | 13,001,703 | 3,174 | 4,096.3 |
| stringr | Hadley Wickham | 11,547,828 | 268 | 43,088.9 |
| stringi | Marek Gagolewski | 11,310,113 | 122 | 92,705.8 |
| digest | Dirk Eddelbuettel with contributions by Antoine Lucas | 11,233,244 | 42 | 267,458.2 |
| plyr | Hadley Wickham | 10,340,396 | 470 | 22,000.8 |
| R6 | Winston Chang | 9,993,128 | 212 | 47,137.4 |
| reshape2 | Hadley Wickham | 9,582,245 | 173 | 55,388.7 |
| scales | Hadley Wickham | 9,380,757 | 115 | 81,571.8 |
| jsonlite | Jeroen Ooms | 9,112,790 | 176 | 51,777.2 |
Top 10 Packages by Stars per Download (frequently starred)
| Name | Author | Downloads | Stars | Downloads Per Star |
|---|---|---|---|---|
| r2d3 | Javier Luraschi | 416 | 235 | 1.77 |
| workflowr | John Blischak | 448 | 169 | 2.65 |
| goodpractice | Hannah Frick | 523 | 192 | 2.72 |
| xtensor | Johan Mabille | 2,057 | 664 | 3.10 |
| scico | Thomas Lin Pedersen | 185 | 59 | 3.14 |
| shinytest | Winston Chang | 418 | 113 | 3.70 |
| furrr | Davis Vaughan | 724 | 171 | 4.23 |
| pkgdown | Hadley Wickham | 1,589 | 332 | 4.79 |
| rtika | Sasha Goodman | 168 | 32 | 5.25 |
| mindr | Peng Zhao | 2,051 | 368 | 5.57 |
Bottom 10 Packages by Stars per Download (infrequently starred)
| Name | Author | Downloads | Stars | Downloads Per Star |
|---|---|---|---|---|
| mime | Yihui Xie | 7,398,765 | 12 | 616,563.8 |
| pkgmaker | Renaud Gaujoux | 1,228,173 | 2 | 614,086.5 |
| rngtools | Renaud Gaujoux | 1,224,959 | 2 | 612,479.5 |
| magic | Robin K. S. Hankin | 344,741 | 1 | 344,741.0 |
| gsubfn | G. Grothendieck | 675,056 | 2 | 337,528.0 |
| bindrcpp | Kirill Müller | 2,996,452 | 10 | 299,645.2 |
| plogr | Kirill Müller | 3,343,099 | 12 | 278,591.6 |
| digest | Dirk Eddelbuettel with contributions by Antoine Lucas | 11,233,244 | 42 | 267,458.2 |
| munsell | Charlotte Wickham | 7,778,712 | 31 | 250,926.2 |
| proto | Hadley Wickham | 2,593,246 | 11 | 235,749.6 |
Full Script
Below and available via gist with data at: https://gist.github.com/StevenMMortimer/1b4b626d3d91240a77f969ae04b37114
# load packages & custom functions ---------------------------------------------

library(tidyverse)
library(httr)
library(cranlogs)
library(ggrepel)
library(scales)
library(knitr)
library(stringr)

gh_from_url <- function(x){
  if(!grepl(',', x)){
    x <- strsplit(x, " ")[[1]]
    x <- trimws(x[min(which(grepl(pattern='http://github.com|https://github.com|http://www.github.com', x, ignore.case=TRUE)))])
  } else {
    x <- strsplit(x, ",")[[1]]
    x <- trimws(x[min(which(grepl(pattern='http://github.com|https://github.com|http://www.github.com', x, ignore.case=TRUE)))])
  }
  x <- gsub("http://", "https://", tolower(x))
  x <- gsub("www\\.github\\.com", "github.com", x)
  x <- gsub("/$", "", x)
  x <- gsub("^github.com", "https://github.com", x)
  x <- gsub("/issues", "", x)
  x <- gsub("\\.git", "", x)
  return(x)
}

aut_maintainer_from_details <- function(x){
  x <- gsub("'|\"", "", x)
  if(grepl(',', x)){
    x <- strsplit(x, "\\],")[[1]]
    aut_cre_ind <- grepl(pattern='\\[aut, cre|\\[cre, aut|\\[cre', x, ignore.case=TRUE)
    if(any(aut_cre_ind)){
      x <- x[min(which(aut_cre_ind))]
      x <- gsub("\\[aut, cre|\\[cre, aut|\\[cre", "", x)
    }
    x <- strsplit(x, ",")[[1]][1]
    x <- trimws(gsub("\\]", "", x))
    x <- trimws(gsub(" \\[aut", "", x))
  }
  return(x)
}

gh_star_count <- function(url){
  stars  <- tryCatch({
    this_url <- gsub("https://github.com/", "https://api.github.com/repos/", url)
    req <- GET(this_url, gtoken)
    stop_for_status(req)
    cont <- content(req)
    cont$stargazers_count
  }, error = function(e){
    return(NA_integer_)
  })
  return(stars)
}

# authenticate to github -------------------------------------------------------
# use Hadley's key and secret
myapp <- oauth_app("github",
                   key = "56b637a5baffac62cad9",
                   secret = "8e107541ae1791259e9987d544ca568633da2ebf")
github_token <- oauth2.0_token(oauth_endpoints("github"), myapp)
gtoken <- config(token = github_token)

# pull list of packages --------------------------------------------------------

# get list of currently available packages on CRAN
pkgs <- tools::CRAN_package_db()

# remove duplicate MD5sum column since tibbles can't handle duplicate column names
pkgs <- pkgs[,unique(names(pkgs))]

# filter out lines any duplicates
pkgs <- pkgs %>%
  rename(Name = Package) %>%
  distinct(Name, .keep_all = TRUE)

# get details for each package -------------------------------------------------

all_pkg_details <- NULL

# old fashioned looping!
# WARNING: This takes awhile to complete
for(i in 1:nrow(pkgs)){

  if(i %% 100 == 0){
    message(sprintf("Processing package #%s out of %s", i, nrow(pkgs)))
  }

  this_url <- pkgs[i,]$URL
  on_github <- FALSE
  this_github_url <- NA_character_
  gh_stars <- NA_integer_
  if(!is.null(this_url)){
    on_github <- grepl('http://github.com|https://github.com|http://www.github.com', this_url)
    if(on_github){
      this_github_url <- gh_from_url(this_url)
      gh_stars <- gh_star_count(this_github_url)
    } else {
      # check the BugReports URL as a backup (e.g. shiny package references GitHub this way)
      issues_on_github <- grepl('http://github.com|https://github.com|http://www.github.com', pkgs[i,]$BugReports)
      if(length(issues_on_github) == 0 || !issues_on_github){
        this_github_url <- NA_character_
      } else {
        this_github_url <- gh_from_url(pkgs[i,]$BugReports)
        gh_stars <- gh_star_count(this_github_url)
        on_github <- TRUE
      }
    }
  } else {
    this_url <- NA_character_
  }

  downloads <- cran_downloads(pkgs[i,]$Name, from = "2014-01-01", to = "2018-06-15")

  all_pkg_details <- rbind(all_pkg_details,
                           tibble(name = pkgs[i,]$Name,
                                  published = pkgs[i,]$Published,
                                  author = aut_maintainer_from_details(pkgs[i,]$Author),
                                  url = this_url,
                                  github_ind = on_github,
                                  github_url = this_github_url,
                                  downloads = sum(downloads$count),
                                  stars = gh_stars
                           )
  )
}

# basic summary stats ----------------------------------------------------------

# remove observations where the GitHub URL refers to a repository that
# is not specific to R and therefore might have an inflated star count
all_pkg_details_clean <- all_pkg_details %>%
  filter(!(name %in% c('xgboost', 'h2o', 'feather'))) %>%
  mutate(downloads_per_star = downloads / stars,
         downloads_per_star = ifelse(!is.finite(downloads_per_star), NA_real_, downloads_per_star))

# proportion of all packages listing github
sum(all_pkg_details$github_ind)
mean(all_pkg_details$github_ind)
# proportion of packages with stars
mean(!is.na(all_pkg_details$stars))

# typical number of stars per package
mean(all_pkg_details_clean$stars, na.rm=TRUE)
median(all_pkg_details_clean$stars, na.rm=TRUE)
max(all_pkg_details_clean$stars, na.rm=TRUE)

# typical number of downloads per package
mean(all_pkg_details_clean$downloads, na.rm=TRUE)
median(all_pkg_details_clean$downloads, na.rm=TRUE)

# percent of packages over 10 stars
mean(all_pkg_details_clean$stars > 10, na.rm=TRUE)

mean(all_pkg_details_clean$downloads_per_star, na.rm=TRUE)
median(all_pkg_details_clean$downloads_per_star, na.rm=TRUE)


# stars histogram --------------------------------------------------------------
ggplot(data=all_pkg_details_clean, mapping=aes(stars)) +
  geom_histogram(aes(fill=..count..), bins=60) +
  scale_x_continuous(trans = "log1p", breaks=c(0,1,2,3,10,100,1000,3000)) +
  labs(x = "Stars",
       y = "Count",
       fill = "Count",
       caption = "Source: api.github.com as of 6/16/18") +
  ggtitle("Distribution of GitHub Stars on R Packages") +
  theme_bw() +
  theme(panel.grid.minor = element_blank(),
        plot.caption=element_text(hjust = 0))

# stars to downloads scatterplot -----------------------------------------------
plot_dat <- all_pkg_details_clean
idx_label <- which(with(plot_dat, downloads > 10000000 | stars > 1000))
plot_dat$name2 <- plot_dat$name
plot_dat$name <- ""
plot_dat$name[idx_label] <- plot_dat$name2[idx_label]

ggplot(data=plot_dat, aes(stars, downloads, label = name)) +
  geom_point(color = ifelse(plot_dat$name == "", "grey50", "red")) +
  geom_text_repel(box.padding = .5) +
  scale_y_continuous(labels = comma) +
  scale_x_continuous(labels = comma) +
  labs(x = "GitHub Stars",
       y = "CRAN Downloads",
       caption = "Sources:\napi.github.com as of 6/16/18\ncranlogs as of 1/1/14 - 6/15/18") +
  ggtitle("Relationship Between CRAN Downloads and GitHub Stars") +
  theme_bw() +
  theme(plot.caption=element_text(hjust = 0))

# author stats -----------------------------------------------------------------

# summary by author
authors_detail <- all_pkg_details_clean %>%
  group_by(author) %>%
  summarize(downloads = sum(downloads, na.rm=TRUE),
            stars = sum(stars, na.rm=TRUE)) %>%
  mutate(downloads_per_star = downloads / stars,
         downloads_per_star = ifelse(!is.finite(downloads_per_star), NA_real_, downloads_per_star)) %>%
  arrange(desc(downloads))

# popular authors
pop_authors <- tibble(author = c('Hadley Wickham',
                                 'Dirk Eddelbuettel',
                                 'Yihui Xie',
                                 'Winston Chang',
                                 'Jennifer Bryan',
                                 'JJ Allaire',
                                 'Jeroen Ooms',
                                 'Scott Chamberlain',
                                 'Jim Hester',
                                 'Kirill Müller'),
                      notable_packages = c('ggplot2, dplyr, httr',
                                           'Rcpp, BH',
                                           'knitr, rmarkdown, bookdown',
                                           'R6, shiny',
                                           'readxl, gapminder, googlesheets',
                                           'rstudioapi, reticulate, tensorflow',
                                           'jsonlite, curl, openssl',
                                           'geojsonio, taxize',
                                           'devtools, memoise, readr',
                                           'tibble, DBI')
)
author_stats <- pop_authors %>%
  inner_join(., authors_detail, by='author') %>%
  select(author, notable_packages, downloads, stars, downloads_per_star) %>%
  mutate(downloads_per_star = round(downloads_per_star, 1)) %>%
  rename_all(. %>% gsub("_", " ", .) %>% str_to_title)

# single author
#all_pkg_details_clean %>% filter(author == 'Dirk Eddelbuettel') %>% arrange(desc(downloads))

# top 10 lists -----------------------------------------------------------------

# Top 10 Most Starred Packages

top_starred <- all_pkg_details_clean %>%
  select(name, author, downloads, stars, downloads_per_star) %>%
  arrange(desc(stars)) %>%
  slice(1:10) %>%
  mutate(downloads_per_star = round(downloads_per_star, 1)) %>%
  rename_all(. %>% gsub("_", " ", .) %>% str_to_title)

# Top 10 Most Downloaded Packages with stars

top_downloaded <- all_pkg_details_clean %>%
  filter(!is.na(stars)) %>%
  select(name, author, downloads, stars, downloads_per_star) %>%
  arrange(desc(downloads)) %>%
  slice(1:10) %>%
  mutate(downloads_per_star = round(downloads_per_star, 1)) %>%
  rename_all(. %>% gsub("_", " ", .) %>% str_to_title)

# Bottom 10 Packages by Downloads per Star (frequently starred)

frequently_starred <- all_pkg_details_clean %>%
  filter(downloads > 100) %>%
  select(name, author, downloads, stars, downloads_per_star) %>%
  arrange(downloads_per_star) %>%
  slice(1:10) %>%
  mutate(downloads_per_star = round(downloads_per_star, 2)) %>%
  rename_all(. %>% gsub("_", " ", .) %>% str_to_title)

# Top 10 Packages by Downloads per Star (infrequently starred)

infrequently_starred <- all_pkg_details_clean %>%
  select(name, author, downloads, stars, downloads_per_star) %>%
  arrange(desc(downloads_per_star)) %>%
  slice(1:10) %>%
  rename_all(. %>% gsub("_", " ", .) %>% str_to_title)